Cinema's Wild Frontier:
Analyzing the West through Data
A data visualization website that explores the history of Western films
Roles
Designer • Programmer
Technical Stack
Overview
A narrative website that analyzes the history of Western films, exploring its evolution, themes, popularity, and cultural impact over the decades. The website features a variety of interactive data visualizations, as well as fitting styling and design.
Showcase
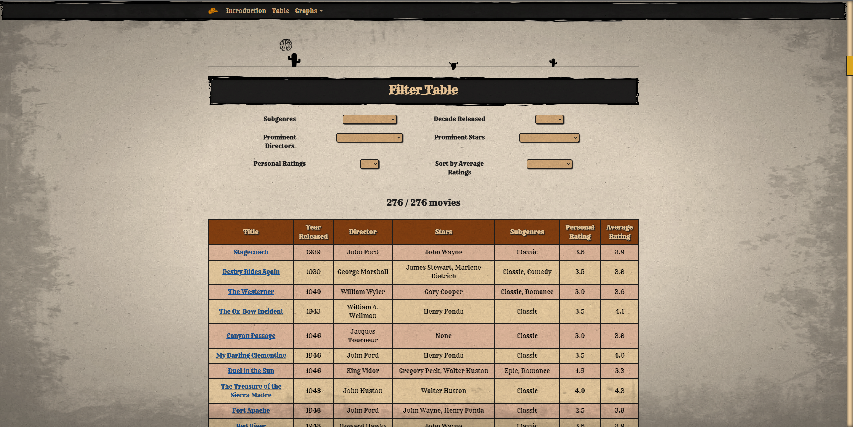
React Table
With over 250 Western films, the React Table allows users to sort and filter the data to find the information they are looking for by dynamically updating to show only the relevant films.

Graphs
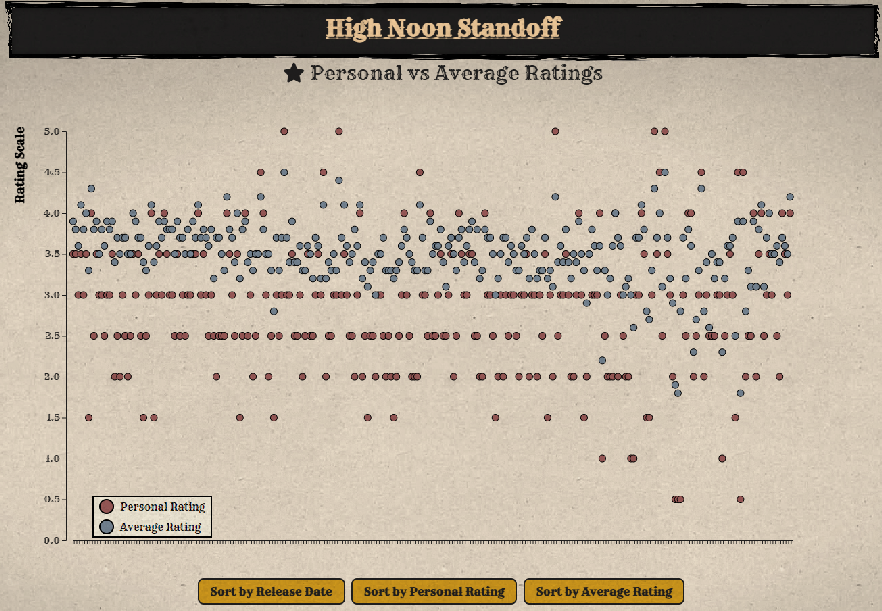
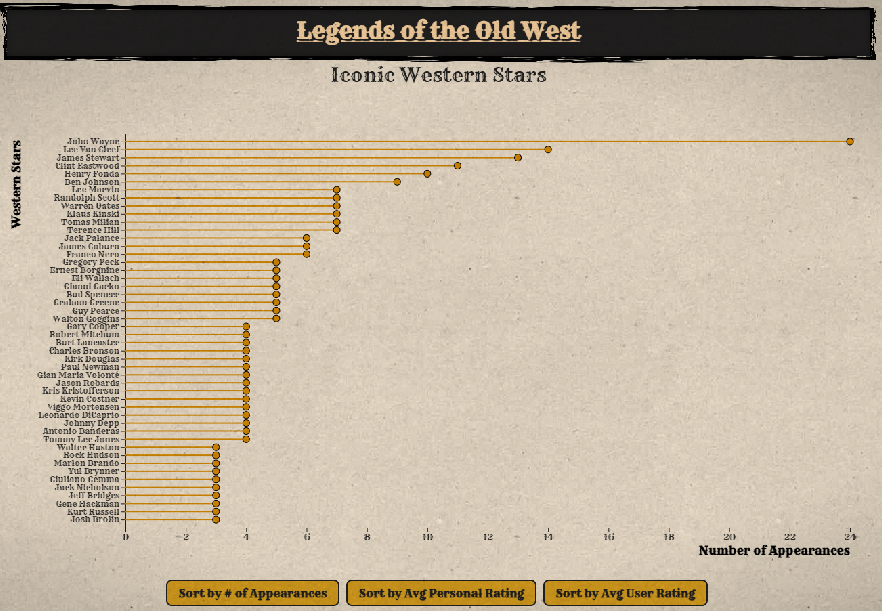
Several graphs are used to visualize the data, including a
scatterplot and line graph. These graphs help to illustrate the
relationship between different variables in the Westerns and how
they have changed over time.
These graphs are interactive, allowing users to hover over
points to see more information and to zoom in on specific
sections of the graph. Several of the graphs also have sorting
buttons to allow users to sort the data by different variables.
After each graph, there is a brief analysis of the data and what
it means for the Western genre, tying the data back to the
narrative of the website.


Challenges
The biggest challenge was finding a way to present the data in a way
that was both visually appealing and easy to understand. I decided
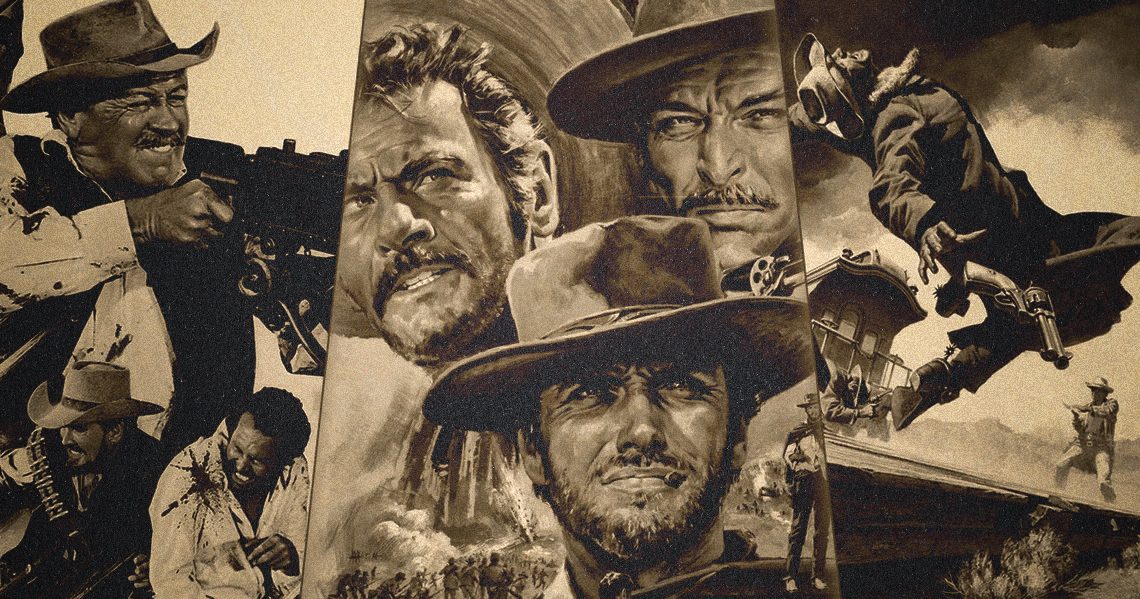
to try to emulate the look of a Western film, using a color scheme
and fonts that were reminiscent of the genre. I even used several
overlays to give the website a more rustic and worn look.
Another challenge was creating the D3 graphs. I had never used D3
before, so I had to learn how to use it from scratch. I also had to
figure out how to make the graphs interactive, which was a bit
tricky. However, I was able to figure it out and create an
interactive and visually appealing set of graphs.